(This is my personal note on what I do for speaker measurements. It is not a tutorial to teach a beginner how to do speaker measurements.)
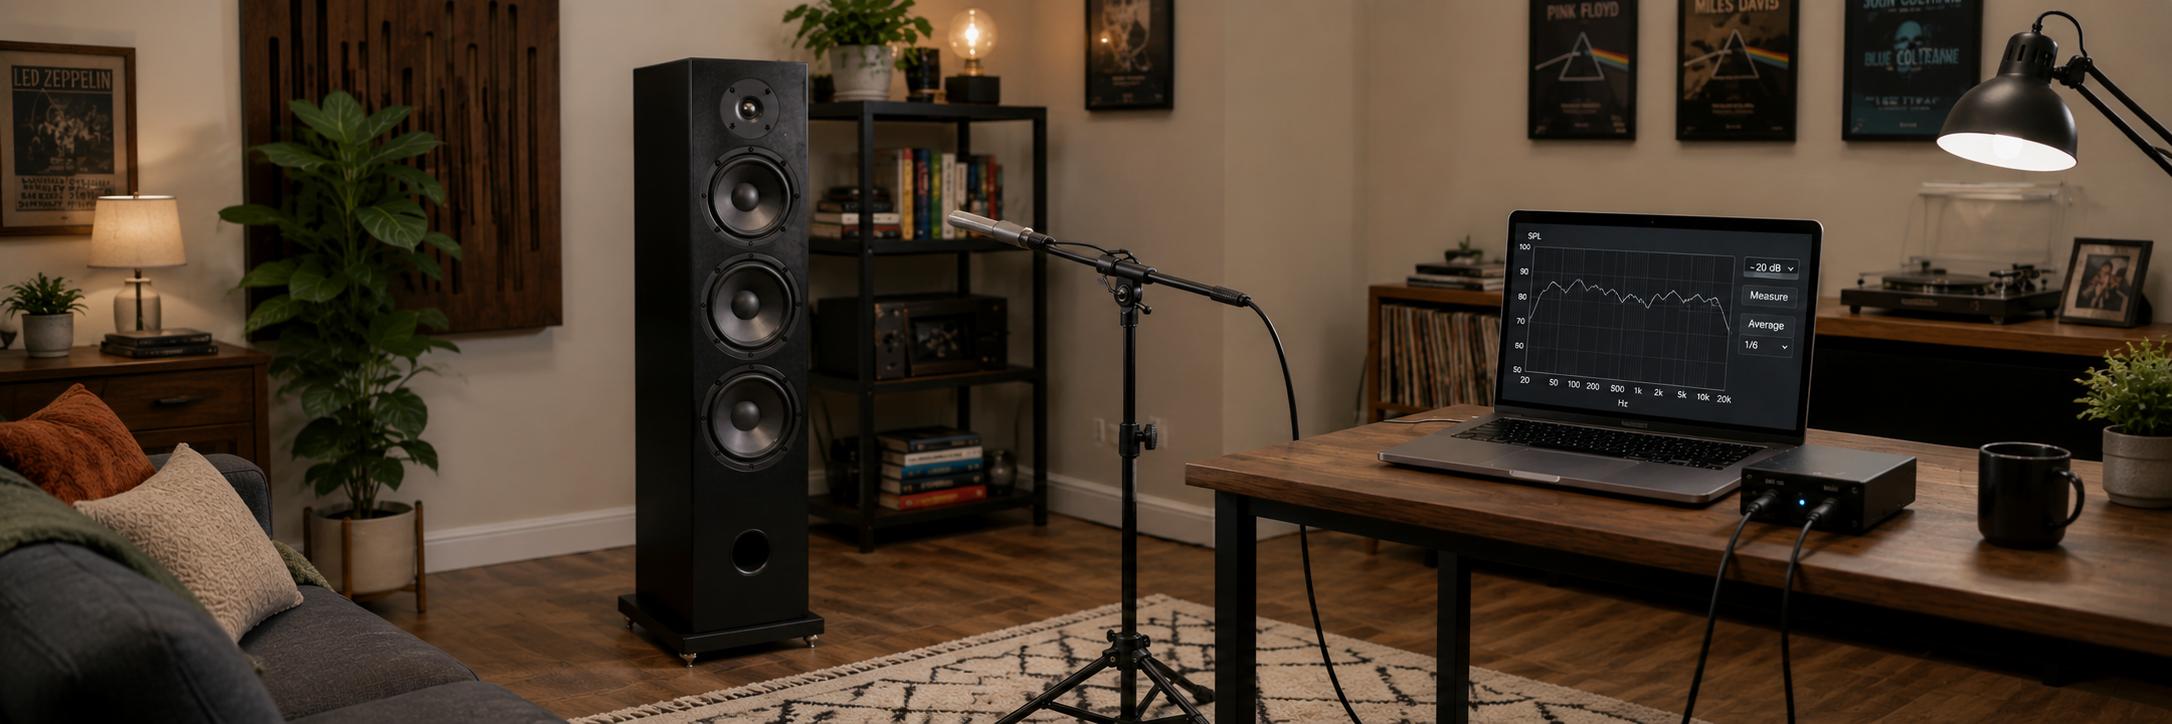
These are the measurements I do for 3-way speakers. For frequency response and harmonic distortion measurements, I use
- ARTA,
- a calibrated Dayton Audio EMM6 XLR mic bought from Cross Spectrum Labs, and
- a Focusrite Scarlett 2i2
- any decent solid state amp I have lying around
For impedance measurements, I use
In ARTA, I set sampling rate to 96KHz, signal type to swept sine, with 128K or 256K sample size. For gated farfield, periodic noise or swept sine signal types may be used. I find swept sine works just as accurately for me for all measurements, so I just use swept sine.
Then I hook up the amp to the speakers, the mic to one input of the Scarlett 2i2, and feed the output of the Scarlett 2i2 to the amp. The second output and second input of the 2i2 are connected using a loopback signal cable, to let me do double-channel recordings. (This is supported by ARTA and others, and eliminates timing errors from measurements, which means phase errors in speaker data.)
Input level setting
I have a mic level calibrator, which I bought used off eBay. (I think it’s the Ametek AC-1 acoustical calibrator.) That battery-operated device can emit a sine wave beep at absolute decibel levels of 94dB, 104dB, 114dB, etc. I put the tip of my mic into the calibrator’s hole, set the calibrator to emit 114dB, then adjust the mic input gain on the Scarlett 2i2 to not clip. Then I go to ARTA and set the mic calibration in the software to 114dB. Essentially, this step tells ARTA that if the mic sends a signal to the laptop of this magnitude in future, ARTA should treat it as 114dB.
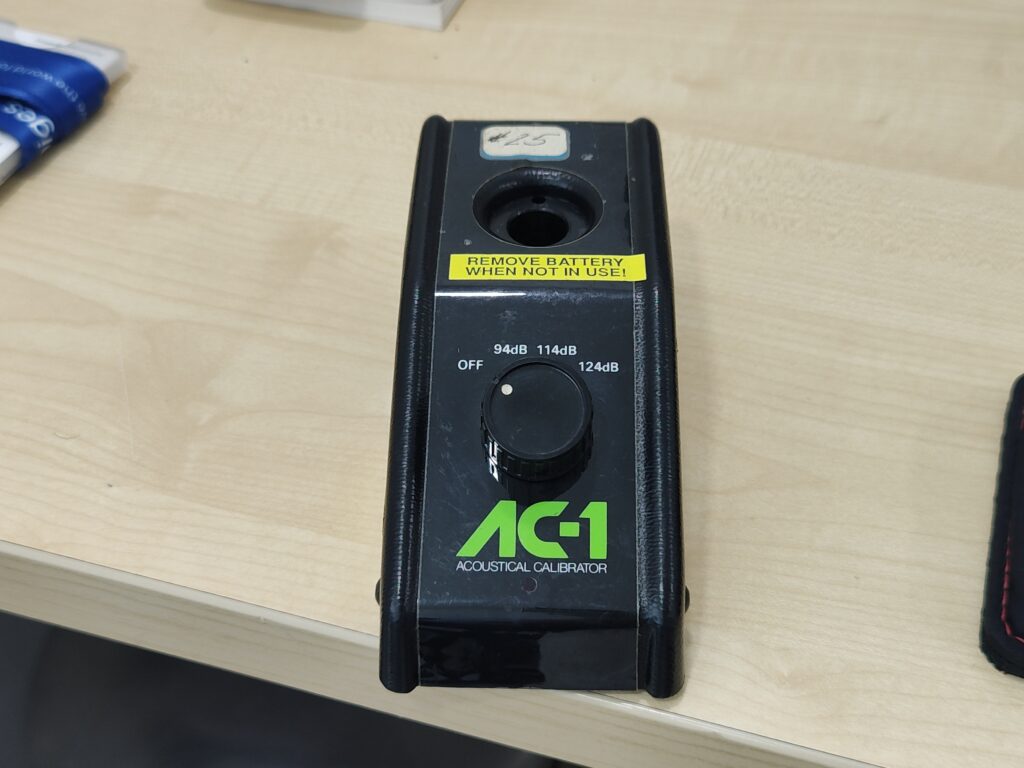
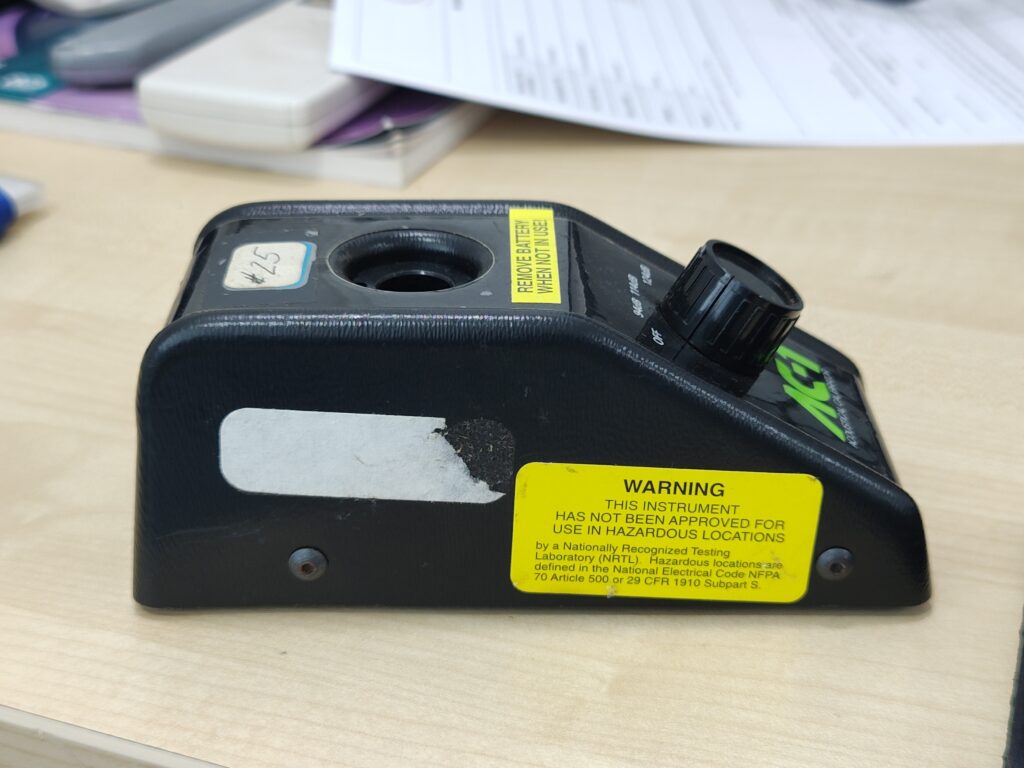
Once this is done, I cannot touch the gain control knob of the Scarlett 2i2. In exchange, what I get is that when ARTA tells me a SPL graph which is flat at, say 100dB, that’s actual absolute 100dB.
Amp gain setting
I now do
- a trial nearfield swept sine of the midrange and
- nearfield swept sine of the woofer,
with the mic at 5mm from the cone of the respective driver. I set the volume control of the amp such that there is no clipping on the Scarlett 2i2 input. If the setup doesn’t clip with these two, it won’t clip with the rest.
Setting the amp gain to avoid mic clipping is very easy on the Scarlett 2i2 because it has a coloured ring which is off when there’s no input, green when there’s acceptable input, and red when the input is over-driving the ADC. So, you just set whichever gain control is needed to ensure that the Scarlett 2i2 stays within the green band just below the level when it begins changing colour to red.
Taking the SPL measurements
Then, without changing any gain setting, I do the following:
- Tweeter: gated farfield, on axis, 1 metre for frequency response
- Tweeter: nearfield, on axis, 30cm, for HD (harmonic distortion)
- Midrange: gated farfield, on tweeter axis, 1 metre, for frequency response
- Midrange: gated farfield, on midrange axis, 1 metre, for frequency response
- Midrange: nearfield, on midrange axis, 5mm, for low frequency SPL
- Midrange nearfield as above, with different settings, to get low frequency HD data
- Midrange: ungated, on midrange axis, 30cm, for high frequency HD
- Woofer: gated farfield, on tweeter axis, 1 metre, for frequency response (useless, no one needs to know the high frequency response of a woofer, but I take it anyway just to see what it looks like)
- Woofer: gated farfield, on woofer axis: 1 metre, for frequency response (ditto — no one needs this for a woofer)
- Woofer: ungated, on woofer axis, 30cm, for high frequency HD (just for curiosity, not useful, because we don’t care about high frequency performance of a woofer)
- Woofer: nearfield, 5mm for low frequency response
- Woofer: ungated, 5mm for low frequency HD
There are five measurements done for HD: #2, #6, #7, #10, and #12. (Out of these, #10 is optional.) For these five readings, the ARTA settings need to be changed for frequency response and harmonic distortion measurement.
- For HD measurements, the double-channel recording needs to be disabled and the centre-at-peak-of-impulse-response checkbox needs to be switched on.
- For the rest of the readings, double-channel recording needs to be enabled and centre-at-peak-of- impulse-response needs to be switched off.
I use 1/24 octave smoothing for SPL for all gated measurements, and up to 1/6 octave for ungated readings.
These 12 readings can be done in any order, provided that the distance from the front baffle is accurately maintained between #1 and #3. In order to do these two measurements with as accurate a phase coherence as possible, I try to do these two one after the other, without moving the mic, so that the mic is exactly at the same spot. These two readings are the primary readings for designing a phase coherent mid-to-tweeter xo.
If I have two woofers, then for nearfield measurements at 5mm, I keep the mic near one woofer’s cone and drive both woofers if they are electrically connected (as in WMTMW designs, etc). For on-axis farfield measurements, like #3 or #8, or 30cm nearfield like #10, the “axis” is the midpoint between the two woofers, which means the mic is equally off-axis from each of the two drivers. Ditto for two midranges like the Dynaudio Confidence 60.
Each measurement is stored in an ARTA .pir file.
Impedance measurements
This is done using DATS. I connect DATS to each driver and take the impedance measurements. The drivers must be mounted on the enclosure before the measurements, so that any impact the enclosure has on the driver may be captured. (May be important for midrange impedance measurement, which may show changes in the region of the woofer-to-mid crossover.)
When I have two woofers or two mids, I connect them to each other in the manner in which I will finally use them, in series or parallel, and then take one impedance measurement. This may not be the approach everyone will approve of — some designers take separate measurements, and then hook them up in the crossover design software in the way they will finally be connected. Whatever you do, keep the SPL measurement and impedance measurement techniques consistent. If you measure SPL separately, measure impedance separately too, and so on.
Feeding to crossover design
The following are now done with the measured data for crossover design:
- I convert all the gated farfield readings which were taken for frequency response measurements from impulse to frequency response by applying the appropriate gating. This set includes #1, #3, and #4. I then save them as FRD files.
- I convert the balance frequency response measurements to FRD too, but without gating. This set includes #5, #8, #9 and #11. These are nearfield, and gating does not apply.
- I take all the HD measurement readings, display their data as distortion plots in ARTA, and save the images as plots to look at later, to help me decide crossover points when crossover design actually starts. This set includes #2, #6, #7, #10, and #12. This now covers all 12 readings.
- Now I merge LF and HF for the midrange and woofer. For the midrange, I merge #3 and #5. (Note, it’s not #4 and #5.) For the woofer, I merge #8 and #11. This merging is done in VituixCAD, using its merging tool. This tool takes the respective FRD files as input and generates a new FRD file as output. Merging of these pairs of SPL datasets is a slightly dicey, black-magic thing, which I’m lucky to get right whenever the crossover design turns out good and I know that my measurements turned out right.
- Finally, for each FRD file, I display the graph and save it as a PNG image, so that I can look at the graph later to help me think what the crossover will need. It’s easy to display the measured data from a PIR file in ARTA — you can simply ask ARTA to show you the SPL graph, and save the image. But if you are starting with an FRD file, then ARTA does not open it, you need to create a dummy crossover in VituixCAD with one driver, attach the FRD file to that driver, and save the SPL graph image.
This brings me to the point where crossover design can start.
Crossover design
I will not describe how I do crossover design. I will only mention how this data helps me decide what to do in my crossover.
I now have all the FRD data files for crossover design, and the PNG images corresponding to them. I need just three FRD files
- the tweeter FRD, obtained from measurement #1
- the midrange merged FRD file, obtained after merging the midrange nearfield and farfield data
- the woofer merged FRD file, ditto for the woofer
and three ZMA (impedance) files. I stare at the PNG images of
- the three SPL curves: tweeter, midrange, and woofer
- the HD plot of the tweeter
- the HD plots, nearfield and farfield, of the midrange
- the nearfield HD plot of the woofer
This inspection gives me an idea of the comfort zone of each driver (where the HD is low) and the ugly cone breakup zones of the midrange and woofer. I haven’t yet worked with ugly woofers, but midranges often have cone breakup zones, which show up as jagged peaks and troughs in its SPL curve, and spikes in its HD plot. This identification of the comfort zones lets me decide the bands in which I will need to put the tweeter-to-mid and the mid-to-woofer crossover.
I also stare at the PNG images of the impedance plots, to see squiggles. Those squiggles tell me the frequencies at which there are reflections and resonances in the driver, and if possible, I try to keep those spots out of the passband in the crossover.
Then I start the work of crossover design. That’s a whole different story, one which I do not intend to write. I open VituixCAD, load the FRD and impedance files for the three drivers, chant some magic incantations in Latin, Sanskrit and four-letter curses, and start my work.
About off-axis SPL measurements
The more scientific way to measure speakers for crossover modelling is by taking a whole bunch of readings where I take just one. Wherever I take one on-axis gated farfield reading, the modern approach suggests that I take one on-axis, plus many off-axis in the horizontal plane, maybe 15 degrees apart, plus many off-axis in the vertical plane, again 15 degrees apart. This means that where I have 1 or 2 SPL measurements per driver currently, I’ll accumulate perhaps two dozen per driver.
Modern crossover modelling software like SoundEasy or VituixCAD are able to process this set of readings and model the on-axis and off-axis behaviour of speaker and crossover very well. This leads to a crossover design whose modelled behaviour on screen matches the in-room behaviour which the listener experiences more closely.
I admit that I do not do that. I do not have the equipment to do this (you need a turntable on which you place the speaker and rotate it) and the patience too. So far, the speakers I have designed with just my on-axis measurements seem to have turned out well, but I agree that the off-axis readings would make for more accurate crossover designs.
* * * * *